
Construction productivity tracking measures how effectively labor hours turn into real work delivered, such as installed units, completed phases, or earned hours compared to budget.
It answers a simple but critical question:
Are we getting the production we expected for the labor we’re paying for?
Unlike basic time tracking that only records clock-ins and timesheets, true productivity tracking connects verified labor time to actual output. When contractors can see both hours worked and work completed in real time, they can spot performance issues early, control labor costs, and protect project margins.
Effective productivity tracking relies on five core components working together:
- Verified labor time (accurate, trustable hours)
- Installed quantities or measurable work units
- Crew and cost code context (who did what work)
- Plan vs. actual comparison (budget variance)
- Real-time visibility and actionable insights
Once these pieces are connected in one system, contractors can measure productivity accurately, forecast outcomes, and make corrective decisions before profit slips away.
Before evaluating construction productivity tracking software, consider what forms the foundation: accurate time tracking from the field. Job costing accuracy, resource allocation decisions, and predictive analytics depend on this baseline. When source data contains errors, subsequent analysis reflects those inaccuracies.
This evaluation follows our comprehensive software review methodology, examining seven factors: time accuracy & fraud prevention, field readiness & deployment, construction-specific features, integration ecosystem, scalability, user experience & support, and value & transparency.
We’ll examine what each tool handles effectively, where limitations appear, and how to select based on operational requirements rather than feature checklists alone. But before we dive into that, let’s determine what construction productivity software really is.
What Is Construction Productivity Tracking Software?
Construction productivity tracking software measures how efficiently crews convert labor hours into completed work – analyzing output per worker, cost performance against budget, and resource management across jobsites.
Unlike basic time tracking that captures clock-in/clock-out data, productivity tracking connects time with cost codes, production quantities, and project budgets to reveal which crews operate profitably and which face efficiency challenges.
Many contractors adopt comprehensive project management platforms expecting productivity tracking to come built-in. Tools like Procore, Buildertrend, and similar solutions excel at schedules, RFIs, and document control – but weren’t designed to prevent buddy punching or capture real-time labor deployment across 20 jobsites. Effective construction productivity tracking requires accurate time tracking as its foundation.
In 2026, tracking construction field productivity relies on integrating digital tools with standardized measurement techniques. Effective construction productivity tracking utilizes a blend of digital tools, manual methods, and data analysis to monitor progress, manage costs, and ensure quality. It increasingly relies on digital tools like mobile apps, AI, and IoT to provide real-time insights that were previously impossible with manual methods like checklists and spreadsheets.
Key Construction Productivity Metrics to Track
Effective construction productivity tracking relies on specific metrics that connect labor input to work output:
Labor Productivity: Installed Quantity ÷ Labor Hours
- Example: 150 linear feet of conduit installed ÷ 8 electrician-hours = 18.75 feet per hour
Earned Hours: Installed Quantity × Standard Rate
- Compares work actually completed against estimated productivity rates
Productivity Factor: Earned Hours ÷ Actual Hours
- A factor of 1.0 means you’re on target; above 1.0 means exceeding productivity; below 1.0 signals inefficiency
Budget Variance: Planned Cost vs Actual Cost
- Reveals whether labor costs align with estimates at project and phase level
The stronger the productivity tracking system, the more it automates these calculations – eliminating spreadsheet guesswork and providing real-time insights that drive operational decisions.
Comprehensive Construction Productivity Tracking Framework
Effective construction productivity tracking requires monitoring three interconnected metrics at the cost code level, tracked consistently week-to-week and month-to-month by crew:
1. Hours Tracking (Labor Input)
Track these four data points for each cost code:
- Budgeted hours: Labor hours allocated in the estimate
- Actual hours: Verified time from field (biometrically verified, not supervisor estimates)
- Remaining hours: Budget minus actual consumed
- Progress percentage: (Actual Hours ÷ Budgeted Hours) × 100%
This shows whether you’re consuming labor faster or slower than planned.
2. Quantity Tracking (Work Output)
Track these four data points for each cost code:
- Budgeted quantities: Estimated units to install (from takeoff/estimate)
- Actual quantities: Daily field reports documenting installed work (example: “today we poured 10 cubic yards of concrete”)
- Remaining quantities: Budget minus actual installed
- Progress percentage: (Actual Quantities ÷ Budgeted Quantities) × 100%
This shows how much work you’ve actually completed versus the plan.
3. Productivity Analysis (Efficiency)
The critical calculation connecting hours and quantities:
Productivity = Installed Quantities ÷ Labor Hours
Track three productivity metrics:
- Budgeted productivity: Estimated efficiency rate from preconstruction (example: 20 linear feet of conduit per electrician-hour)
- Actual productivity: Real efficiency being achieved in the field (example: 18.75 linear feet per electrician-hour)
- Productivity variance: (Actual Productivity ÷ Budgeted Productivity) × 100%
In this example: (18.75 ÷ 20) × 100% = 93.75% productivity – meaning the crew is 6.25% less efficient than estimated.
Advanced Construction Productivity Formulas
Beyond basic tracking, these formulas provide deeper productivity intelligence:
Earned Hours vs. Burned Hours
This comparison reveals true efficiency regardless of whether you’re ahead or behind schedule:
Earned Hours: Work completed at estimated productivity rates
- Formula: Actual Quantities Installed × Budgeted Hours per Unit
- Example: 150 feet installed × 0.05 hours per foot = 7.5 earned hours
Burned Hours: Actual hours consumed (from verified time tracking)
- Example: 8 actual hours worked
Efficiency Variance: Earned Hours ÷ Burned Hours
- Example: 7.5 ÷ 8 = 0.9375 or 93.75% efficient
- Interpretation: If you earned 100 hours but burned 120 hours, you’re 20% less efficient than estimated
Forecasted Hours
Projects total hours needed based on current productivity performance, enabling proactive decisions before budget exhaustion:
Formula: Forecasted Total Hours = Remaining Quantities ÷ Current Actual Productivity Rate
Example:
- Remaining quantities: 850 linear feet of conduit
- Current actual productivity: 18.75 feet per hour
- Forecasted hours needed: 850 ÷ 18.75 = 45.3 hours
Compare forecasted hours to remaining budget hours. If you have 40 hours budgeted but need 45.3 hours at current productivity, you’re forecasting a 5.3-hour overrun (13% over budget).
Progress Tracking Across All Dimensions
Monitor whether hours consumed, work completed, and productivity align:
- Hours Progress: (Actual Hours ÷ Budgeted Hours) × 100%
- Quantity Progress: (Actual Quantities ÷ Budgeted Quantities) × 100%
- Productivity Variance: (Actual Productivity ÷ Budgeted Productivity) × 100%
Ideal scenario: All three percentages align. If hours progress is 50% and quantity progress is 40%, you’re consuming labor faster than you’re producing work – a leading indicator of budget trouble.
Tracking Frequency and Crew-Level Analysis
Most contractors track these metrics:
- Weekly: Crew-level performance, cost code status, productivity variance
- Monthly: Trend analysis, crew comparisons, forecast accuracy
- By crew: Identify high-performing teams and those needing support
Additional Dashboard Metrics
Two additional metrics provide at-a-glance visibility into project health:
Burn Rate (Labor Consumption Speed)
- Formula: (Actual Hours ÷ Budgeted Hours) × 100
- Meaning: The percentage of labor hours used so far. If over 100%, labor is being spent faster than planned.
Production to Date (Progress Percentage)
- Formula: (Actual Quantities ÷ Budgeted Quantities) × 100
- Meaning: The percentage of total planned work that has been completed. A quick view of job progress for each cost code.
Dashboard Metrics for Real-Time Decision Making
Effective productivity tracking systems present these metrics together, enabling immediate pattern recognition:
- Burn Rate vs. Production to Date: If burn rate is 60% but production is only 45%, you’re consuming labor faster than you’re producing work – an early warning signal.
- Hours Variance trending negative: Signals you’ll exceed labor budget at current pace – time to investigate crew efficiency or scope changes.
- Productivity Efficiency below 90%: Indicates crew is performing 10%+ below estimated productivity – may need training, better tools, or schedule adjustment.
- Forecasted Hours exceeding remaining budget: Shows projected overrun based on current performance – enables proactive cost management.
The goal: spot efficiency problems while correction remains possible, not after margins have eroded. Real-time productivity tracking systems automate these calculations, eliminating manual spreadsheet work and providing dashboard visibility into performance across all active projects.
Our Top 8 Picks for Construction Productivity Tracking Software
Methodology Disclaimer: This analysis is based on publicly available information, vendor documentation, and verified user reviews as of February 2026. Scores reflect our assessment using SmartBarrel’s published evaluation criteria. Software capabilities and features evolve over time. We encourage readers to verify current features, pricing, and capabilities directly with vendors before making purchasing decisions.
Overall Rankings
Rank
Software
Total Score
Rating
Note: Scores reflect alignment with construction industry- specific criteria in our methodology. Lower scores do not indicate poor quality – they may indicate different target markets or use cases. Solutions scoring 75+ are very strong performers for construction applications.
SmartBarrel
Best Suited For: Specialty contractors (100-5,000 employees) managing own employees, temp labor, or hourly subs across multiple jobsites who need true productivity metrics based on verified time, not guesswork

Planera
Best Suited For: Schedulers, general contractors, and project managers working on complex projects who need strong schedule logic, collaboration, and planning transparency rather than time tracking.
Procore
Best Suited For: GCs and owners managing complex projects who need comprehensive productivity metrics beyond just labor hours.
Raken
Best Suited For: Contractors (100-1,000 employees) who prioritize daily production documentation.
Fieldwire
Best Suited For: GCs and specialty contractors needing excellent task coordination and plan management.
Jibble
Best Suited For: Smaller specialty contractors (10-100 employees) with mobile crews who need basic productivity visibility without enterprise complexity.
WorkMax
Best Suited For: Existing Foundation customers or contractors with established ERP integrations who prioritize system compatibility over advanced productivity analytics.
Archdesk
Best Suited For: Mid-to-large UK/EU contractors needing full ERP with basic time tracking as ONE component.
BusyBusy
Best Suited For: Smaller construction firms or subcontractors who want affordable mobile time tracking with GPS.
Raken
Best Suited For: General contractors and large field teams that prioritize project documentation and reporting.
Buddy Punch
Best Suited For: Small businesses operating in controlled environments with reliable connectivity.
Connecteam
Best Suited For: Seskless workers across various industries seeking an all-in-one communication and scheduling platform.
Top Construction Productivity Tracking Software Reviewed
Overview
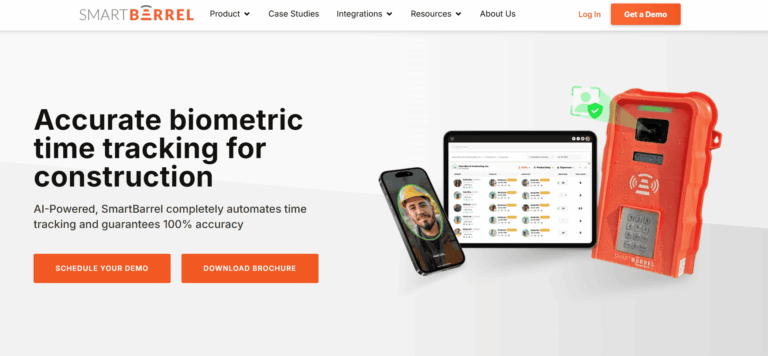
SmartBarrel is a construction time tracking solution designed to deliver the accurate labor data that makes productivity measurement possible. Among the platforms reviewed here, it's the only one using AI-powered facial verification combined with geo-fencing to confirm both identity and jobsite presence at every punch. This ensures the foundation of productivity tracking (verified hours worked) reduces fraud and is audit ready.
Key Features Summary
Best Suited For: SmartBarrel works well for mid to large contractors with 100+ employees, including Mechanical, Electrical, Concrete, Drywall, Solar, and Glass & Glazing contractors who need reliable productivity metrics across multiple jobsites. Works best for:
- Contractors measuring crew efficiency and labor productivity rates
- Teams tracking units completed per labor hour (conduit installed, yards poured, panels mounted)
- Operations comparing estimated vs. actual labor hours at the cost code level
- Companies requiring verified data for T&M productivity documentation
- Multi-site operations needing real-time visibility into labor deployment and efficiency
- Teams seeking to eliminate the 800+ hours annually spent on manual timesheet entry
- Operations requiring accurate job costing to measure project-level productivity
Overall Score
Criteria
Score
Key Features
- that inflates hours by 10-15%, ensuring productivity calculations use actual worked hours, not fraudulent time
- Business Impact: The American Payroll Association (APA) estimates that 75% of companies lose money due to buddy punching.
- Company Vulnerability: A study of audited firms in the construction sector found that 19% of firms committed payroll-related misclassifications or fraud, the highest rate among all industries surveyed.
- Production Tracking Integration: SmartBarrel doesn’t just collect hours – it connects hours with production output so you can spot issues early, forecast completion, and protect margins. Production quantities logged in the field automatically tie back to verified hours worked and cost codes, giving you true productivity metrics at every level: by project, trade, worker, and cost code.
- Real-Time Data Flow: Time entries flow instantly to dashboard with built-in LTE connectivity, enabling same-day productivity analysis instead of week-old data
- One-Click Cost Code Assignment: Assign and split cost codes in minutes with carry-over capability, allowing accurate measurement of productivity by task, crew, and project phase
- Live Multi-Site Dashboard: View current labor deployment, hours worked, and crew productivity across all projects simultaneously for real-time resource optimization
- Compare estimated vs. actual hours at granular cost code level to identify efficiency gaps
- Track crew-level productivity to recognize high performers and address underperformance
- Measure labor hours per unit of output when integrated with production tracking systems
- Generate audit-ready time documentation for T&M productivity verification
- Analyze overtime patterns to distinguish productivity needs from scheduling inefficiencies
Field-First Efficiency
- Multi-Method Check-In: TimeClock 4.0 hardware for sites with 10+ workers, plus Kiosk and Personal apps for flexibility without sacrificing verification
- Self-Registered Fobs: Workers without smartphones can register their own fobs for excuse-free productivity tracking
- Geo-Fencing Technology: Confirms workers are physically present at the jobsite during productive hours
- Automatic Rules Processing: Lunch break deductions, rounding rules, and overtime calculations handled automatically, freeing supervisors to focus on crew productivity instead of timesheet administration
- Weather-Proof Hardware: Solar or electric powered, magnetic mounting, operates in any conditions – ensuring continuous productivity data capture

Productivity Impact
- Documented Savings: $4,285+ per worker annually from eliminated time theft and improved efficiency
- Administrative Time Recovered: 800+ hours saved on manual entry per year – time supervisors can redirect to actual crew management
- Same-Day Visibility: Identify productivity issues while correction remains possible, not days later when budget damage is done
- Removes Foreman Burden: Pre-populated timesheets let foremen focus on crew motivation and productivity instead of timekeeper role
- Current Native Integrations: Procore (Timesheets, Timecards, Daily Logs), CMiC (eTime & timesheets), Viewpoint Vista (Timesheets), PowerBI (productivity analytics), Plexxis
- Compatible ERP/Accounting Systems: Viewpoint Vista & Spectrum, Acumatica, CMiC, ECCS, QuickBooks Online & Desktop, Foundation, ComputerEASE, Jonas, COINS
- In Development: Foundation, Acumatica, Viewpoint Spectrum, Sage Intacct

Pros and Cons
Cons
- No native scheduling/dispatch module for workforce planning
- Some integrations still in development
- Pricing requires sales conversation (not publicly listed)
Pros
- Biometric facial verification eliminates the 10-15% time inflation that undermines productivity calculations
- Real-time data enables same-day productivity analysis and labor redeployment decisions
- Zero manual entry architecture saves 800+ hours annually that can be redirected to productivity improvement
- Removes timekeeper burden from foremen, allowing focus on crew productivity and motivation
- One-click cost code assignment enables accurate productivity measurement by task and crew
- Multi-site dashboard provides real-time visibility into labor deployment efficiency
- Works in all conditions without phone, WiFi, or training requirements
- Multi-company structure support (direct employees, temp labor, hourly subs) with consistent productivity tracking across all workforce segments
Pricing
Contact SmartBarrel for custom pricing. The system typically pays for itself in the first month through eliminated time theft and administrative efficiency gains. Month-to-month options available. Pricing includes hardware + software.
Reviews
4.9/5
3.6/5
4.2/5
Get The Best Portable Time Clock
#2 - Planera - Visual CPM Scheduling & Collaborative Planning
Overview
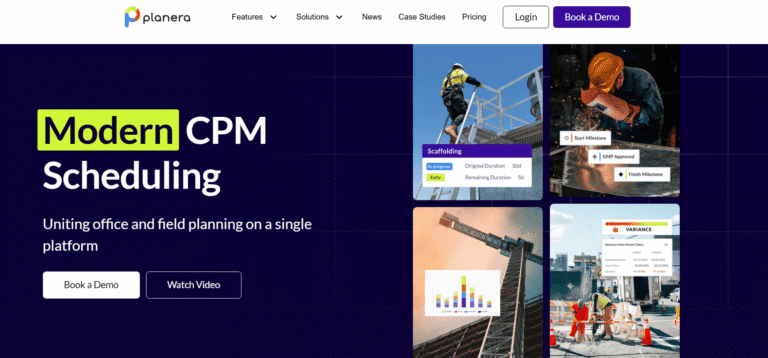
Planera is a cloud-based construction scheduling and planning platform built around modern Critical Path Method (CPM) workflows and real-time collaboration. It is designed as a replacement for legacy scheduling tools like Primavera P6 and Microsoft Project, offering a more visual and intuitive way for construction teams to plan, coordinate, and track work. Planera does not focus on labor time tracking or payroll. Instead, it improves productivity by helping teams build higher-quality schedules, align field execution with master plans, and identify risks earlier in the project lifecycle.
Key Features Summary
- Visual CPM Scheduling
- Real-Time Collaborative Planning
- Master & Field Schedule Alignment
- Progress Tracking & Version Comparison
- Schedule Quality Checks (DCMA)
- Risk & Scenario Analysis
- Project & Resource Dashboards
- Multi-Project Visibility
Best For: Schedulers, general contractors, and project managers working on complex projects who need strong schedule logic, collaboration, and planning transparency rather than time tracking.
The Productivity Impact: Planera improves productivity by turning scheduling into a shared planning process. Teams can visualize dependencies, detect constraints early, and keep schedules aligned with real-world execution, reducing delays caused by miscommunication or poor planning.
Overall Score
Criteria
Score
Key Features
- Visual CPM Scheduling: Schedules are built visually using drag-and-drop logic while maintaining full CPM integrity.
- Real-Time Collaboration: Multiple stakeholders can plan and update schedules simultaneously, improving alignment between office and field teams.
- Master & Field Schedule Alignment: Short-term execution plans remain connected to long-term project milestones.
- Progress Tracking & Version History: Teams can record progress updates and compare schedule versions to understand changes over time.
- Schedule Quality Checks: Built-in DCMA checks help identify missing logic, excessive constraints, and schedule risk.
- Risk & Scenario Analysis: Teams can model schedule changes and understand downstream impacts before committing.
- Dashboards & Metrics: Visual dashboards track progress, plan reliability, and performance trends.
Productivity Analytics Capabilities
- Percent Plan Complete (PPC) tracking
- Progress vs baseline visualization (S-curves)
- Early identification of schedule risk
- Improved reliability of weekly and phase plans
- Better coordination across trades and teams
Integrations
- Works alongside major construction management platforms
- Imports and exports schedules from Primavera P6, Microsoft Project, and Excel
- API support for custom data connections
Pricing
Pricing is not publicly listed and is typically customized based on project scale and organizational needs. Unlimited users are included, with optional onboarding and professional services.
Pros and Cons
Cons
- No labor time tracking or payroll functionality
- Requires consistent team participation to deliver full value
- Pricing transparency limited
- Field adoption depends on planning discipline
Pros
- Strong CPM logic with visual planning tools
- Purpose-built for construction scheduling
- Improves schedule quality and predictability
- Excellent for collaborative planning workflows
- Scales well for large and complex projects
Reviews
Planera is recognized for modernizing construction scheduling by replacing static CPM tools with collaborative, visual planning. It is most valued by teams focused on schedule reliability, coordination, and proactive risk management rather than post-fact productivity measurement.
#3 - Procore - Field Productivity & Quantity Tracking (GC-Oriented)

Overview
Procore serves as the dominant construction management platform for enterprise construction operations. While not purpose-built for time tracking, the platform's strength lies in connecting time data with comprehensive productivity analytics across document control, RFI workflows, submittal tracking, financial management, and coordination across multiple specialty trades on complex construction projects.
Key Features Summary
- Comprehensive Project Management
- Time Tracking Module
- Cost Code Tracking
- Daily Logs
- Multi-Site Portfolio Management
- Safety & Quality Modules
- BIM Coordination
Best For: GCs and owners managing complex projects who need comprehensive productivity metrics beyond just labor hours. Time tracking adequate but not specialized – accept some accuracy trade-off for full-suite project management.
The Productivity Impact: Enterprise productivity ecosystem for construction management software users.
Time feeds comprehensive dashboards connecting labor → budget → schedule → costs. Construction teams can measure on-time performance, cost per unit, and productivity levels across their portfolio.
However, time accuracy limitations may affect the reliability of productivity calculations – the quality of insights depends directly on the quality of source data.
Overall Score
Criteria
Score
Key Features
- Comprehensive Project Management: Document control, RFI management, submittal tracking, change orders, and financial oversight
- Time Tracking Module: GPS geofencing, photo capture on clock-in, timesheet management with audit trails
- Cost Code Tracking: Links time data with project budgets and cost codes for job costing analysis
- Daily Logs: Site activities, weather conditions, and workforce documentation
- Multi-Site Portfolio Management: Centralized visibility across all active projects
- Safety & Quality Modules: Incident reporting, inspections, observations, and compliance tracking
- BIM Coordination: Model viewer for design coordination and clash detection
- Resource Planning: Workforce allocation and equipment scheduling capabilities
- Mobile Field Apps: Full-featured mobile applications for iOS and Android with offline capability
- Advanced Analytics: Custom dashboards, productivity insights, and business intelligence reporting
Productivity Analytics Capabilities
- Custom dashboards track labor cost variance by project and cost code, helping identify more profitable projects
- Real-time budget vs. actual analysis identifies productivity gaps and potential delays before they compound
- Resource planning tools optimize construction workers deployment across multiple projects
- Advanced analytics enable data driven decisions connecting time data with schedule performance and cost metrics
- Portfolio-level visibility enables comparison of crew efficiency and project progress across all active work
- Multi-site operations support helps main contractors streamline workflows and maintain security across projects
Integrations
- App Marketplace: 500+ integration partners including major ERPs, accounting systems, and specialty tools
- Native Connections: Sage 300 CRE, Viewpoint Vista, Foundation, QuickBooks, Xero, and other accounting platforms
- API Access: Robust API for custom integrations and data exchange
- File Management: Connects with Box, Dropbox, Google Drive, OneDrive, and other cloud storage
- Specialty Tools: Links with estimating, scheduling, reality capture, and analytics platforms
Pricing
Pros and Cons
Cons
- Time tracking relies on GPS + photo capture (no biometric facial verification)
- Manual timesheet entry by crew leads remains common practice
- Time can be edited/adjusted after submission without verification
- No fob option for workers without phones
- Requires internet connectivity for real-time data (WiFi or cellular)
- Setup requires significant configuration and training (multi-week implementation typical)
- Higher cost point typically exceeds $10K annually
Pros
- Industry-leading project management ecosystem with 500+ integrations
- Proven at enterprise scale (Fortune 500 contractors, 3M+ projects)
- Comprehensive feature set covers most construction management needs
- Strong mobile apps with offline functionality
- 24/7 support with extensive training resources (Procore University)
- Multi-region, multi-state operations support
- Unlimited users and projects capability
Reviews
4.5/5
4.1/5
4.7/5
#4 - Raken - Daily Reports & Production Visibility

Overview
Raken specializes in daily reporting with integrated time tracking features. The platform's strength is connecting time with production output, though time tracking requires more manual supervisor input compared to automated biometric solutions.
Key Features Summary
- Daily Production Reports
- AI Photo ID Verification
- Time Tracking Options
- GPS Location Tracking
- Custom Clock-In Questions
- Safety Management
- Quality Control
- Cost Code Tracking
Best For: Contractors (100-1,000 employees) who prioritize daily production documentation. Can measure productivity (output per time) if you accept supervisor-led time entry creating 5-15% accuracy gap.
The Productivity Impact: Daily production documentation connects time with output for construction teams.
For example, “Poured 50 yards concrete with 8 construction workers in 6 hours” creates a measurable productivity metric showing where the project stands. Weather documentation shows environmental impact on efficiency and helps identify potential delays.
However, supervisor-led time entry may introduce variance of 5-15% in recorded hours, which affects productivity calculation accuracy.
Overall Score
Criteria
Score
Key Features
- Daily Production Reports: Comprehensive daily logs capturing work completed, conditions, and site activities
- AI Photo ID Verification: Requires pre-loading worker photos for comparison-based verification
- Time Tracking Options: Kiosk mode for group check-in and personal time tracking on individual devices
- GPS Location Tracking: Verifies worker location during clock-in/clock-out
- Custom Clock-In Questions: Configurable questions to verify presence and gather site-specific information
- Safety Management: 100+ pre-built safety templates, toolbox talks, and inspection checklists
- Quality Control: Digital checklists, inspections, and issue tracking
- Cost Code Tracking: Link time entries with cost codes for job costing and production metrics
- Weather Documentation: Automatic weather data capture for each daily report
- Subcontractor Collaboration (Super Dailies): Share information and coordinate across trades
- Custom Payroll Policies: Configure rules for overtime, breaks, and different pay structures
- Photo Documentation: Unlimited photo storage with daily reports and time entries
Productivity Measurement Features
- Link time entries with production quantities to calculate units per labor hour and track project progress
- Weather data automatically documents environmental factors affecting crew productivity levels
- Cost code tracking enables analysis of more profitable projects by task and trade
- Daily logs provide narrative context for productivity variances, helping construction teams make data driven decisions about potential delays, material issues, and equipment problems
- Subcontractor collaboration tools help main contractors coordinate across trades while saving time on manual communication
Integrations
- Accounting & Payroll: QuickBooks, ADP, Paychex, and other payroll processors
- Project Management: Procore, PlanGrid for document coordination
- Cloud Storage: Box, Dropbox for document management
- Reality Capture: Integration with photo documentation and site capture tools
- Limited ERP Connections: No native Vista, CMiC, or Foundation integrations
- API Available: For custom integrations though less robust than enterprise platforms
Pricing
Pros and Cons
Cons
- Photo system requires pre-loading worker photos (no self-learning)
- No true biometric facial verification (comparison-based only)
- Manual timesheet approval allows supervisor override
- No fob option for workers without phones/photos
- Requires smartphones or tablets (no dedicated hardware)
- Not weatherproof (device-dependent)
- Limited offline access (only 5 projects cached)
- Device failure eliminates time tracking capability
- Fewer native integrations
- No month-to-month option mentioned
Pros
- Great daily reporting capabilities for production documentation
- Minimal training required with mobile-first design
- 100+ pre-built safety templates reduce setup time
- Quick deployment with offshore functionality (caches last 5 projects)
- Works well in field conditions on company devices
- Strong customer support with active user community
- Can measure productivity when linking time with production logs
- Weather documentation shows environmental impact on work
- Free trial offered
Reviews
4.6/5
4.3/5
4.8/5
#5 - Fieldwire - Task-Based Execution & Productivity

Overview
Fieldwire, owned by Hilti, focuses on field-office coordination through plan viewing, task management, and punch lists. While strong for task completion tracking, it wasn't purpose-built for workforce time tracking or labor productivity measurement.
Key Features Summary
- Plan Viewing & Markup
- Task Management
- Punch Lists
- RFI Management
- Daily Reporting
- Photo Documentation
- Calendar & Scheduling
Best For: GCs and specialty contractors needing excellent task coordination and plan management. “Are tasks getting done on schedule?” = Yes. “Are we using labor hours efficiently?” = Can’t answer.
NOT For: Contractors needing labor productivity measurement, payroll-ready time data, worker clock-in/out systems, T&M billing documentation, companies saying “we need to track time for productivity metrics.”
Fieldwire Misalignment
Many contractors evaluate Fieldwire as a “productivity tracking” tool because it does an excellent job monitoring task completion and field execution. However, task progress is not the same as labor productivity. Fieldwire helps teams understand what work was completed, but it is not designed to verify work hours or calculate output per labor hour at the crew level.
For contractors focused on labor efficiency and cost performance, Fieldwire is best viewed as a strong project execution platform rather than a dedicated productivity tracking system.
The Productivity Impact: Fieldwire measures task completion rather than labor productivity for construction teams.
The platform excels at tracking project progress and whether construction projects stay on schedule, but doesn’t capture the systematic time data needed to measure productivity levels. This makes it effective for progress tracking but less suitable for analyzing whether labor hours align with budget expectations or identifying more profitable projects.
Overall Score
Criteria
Score
Key Features
- Plan Viewing & Markup: Fast plan viewer that works offline with markup capabilities
- Task Management: Create, assign, and track tasks linked to plan locations
- Punch Lists: Digital punch list creation, assignment, and completion tracking
- RFI Management: Create and track requests for information with photo documentation
- Daily Reporting: Basic daily log capabilities for site activities
- Photo Documentation: Unlimited photo storage with geolocation and timestamps
- Version Control: Automatic version control for drawings and documents
- Calendar & Scheduling: Gantt charts and calendar views for task scheduling
- Custom Task Statuses: Configure task workflows to match company processes
- Offline Functionality: Full access to plans and tasks without internet connection
- Plan Hyperlinking: Link related plans and details together for easy navigation
- Task-Level Time Tracking: Can track hours worked at task completion (not systematic daily time capture)
Project Progress Features
- Task management streamline workflows by linking activities to plan locations
- Calendar scheduling helps construction teams identify potential delays early
- Photo documentation with timestamps supports project progress verification
- Offline functionality ensures construction workers maintain access to plans and tasks without connectivity concerns
- Version control provides security for drawings and documents across multiple project stakeholders
Integrations
- Accounting/Payroll: Some payroll integrations available
- Cloud Storage: Dropbox, Box, Google Drive for document management
- Part of Hilti Ecosystem: Connections with other Hilti tools and services
- Limited Compared to Procore: No 500+ integration marketplace
- No Major ERP Integrations: Vista, CMiC, Foundation not mentioned
- Export Capabilities: Can export data for use in other systems
- No PowerBI/Tableau Native: Limited business intelligence connections
Pricing
Basic
Free
Pro
$39/user/month
Business
$64/user/month
Business Plus
$89/user/month
Pros and Cons
Cons
- Not a time tracking solution (tracks task completion, not clock-in/out)
- No biometric verification whatsoever
- No systematic daily time capture for workforce
- Supervisor reports manpower on tasks (honor system)
- No fraud prevention features
- Can't prevent buddy punching
- Time data unreliable for payroll/productivity calculations
- Not weatherproof hardware (phone/tablet dependent)
- File size limits (25MB per file)
- No payroll integration
- Weak workforce scheduling (no crew scheduling or dispatch)
Pros
- Outstanding plan viewing and markup capabilities
- Excellent offline functionality (syncs when online)
- Fast plan viewer works well on mobile devices
- Under 5-minute setup for new projects
- Designed specifically for field workers
- Strong task management and punch list features
- Transparent pricing with free tier available
- Unlimited projects and storage on premium plans
Reviews
4.6/5
4.3/5
4.8/5
#6 - CrewTracks - Mobile Time Tracking with Basic Productivity Features
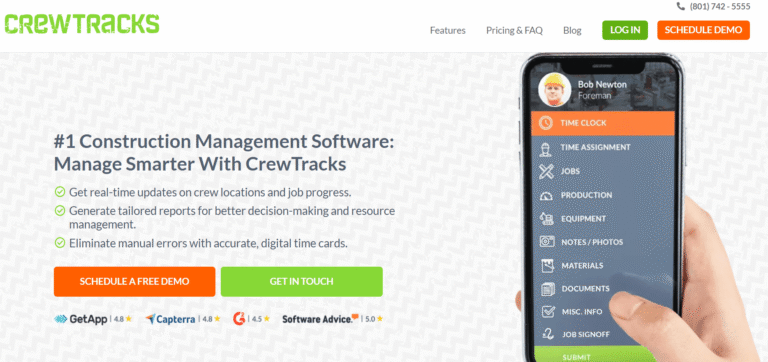
Overview
CrewTracks provides mobile-first time tracking with scheduling capabilities. The platform works well for smaller, mobile crews but lacks sophisticated identity verification features needed for ensuring data accuracy at scale.
Key Features Summary
- Mobile Time Tracking
- Photo Capture
- Location Verification
- Job Costing
- Scheduling & Dispatch
- Equipment Tracking
- Daily Logs
- Break Management
- Editable Timesheets
Best For: Smaller specialty contractors (10-100 employees) with mobile crews who need basic productivity visibility without enterprise complexity. Accept that the honor system + GPS creates 10-20% accuracy gap in time data, therefore productivity metrics.
The Productivity Impact: Provides basic productivity visibility for construction teams.
Basic job costing shows labor cost per construction project. However, the absence of identity verification creates data integrity challenges – when time data accuracy is uncertain, productivity metrics and data driven decisions built on that data inherit the same uncertainty.
Overall Score
Criteria
Score
Key Features
- Time Tracking (Multiple Methods): Mobile app, web app, or kiosk mode for flexible clock-in/out options, QR code scanning, NFC tag support, GPS location stamping at every clock event
- Biometric Verification: Photo capture at clock-in/out, facial recognition matching to prevent buddy punching, verification photos stored with each time entry
- GPS & Geofencing: Real-time location tracking, custom geofence radius per project, prevent clock-in outside designated areas, automatic alerts when workers leave while clocked in
- Time Management: Automated timesheet generation, time-off requests from any device, unlimited custom PTO policies, accrual or allotment systems, approval workflows
- Activity Monitoring: Desktop app screenshots (one every 10 minutes), real-time activity tracking, productivity insights, detailed audit trails
- Reporting & Analytics: Comprehensive time reports, location history, attendance summaries, PTO balances, project-level breakdowns, exportable data formats
Basic Productivity Tracking
- Job costing links time with cost codes for project-level labor cost analysis, helping identify more profitable projects
- Equipment tracking correlates equipment usage with construction workers productivity
- Scheduling and dispatch features help streamline workflows for mobile construction teams
- Basic reporting enables comparison of productivity levels across projects to understand where each project stands
Integrations
- QuickBooks: Primary native integration
- Basic Accounting Exports: CSV, Excel formats
- Limited Ecosystem: Essentially only QuickBooks integration
- No Major ERP Connections: No Vista, CMiC, Foundation, or Procore integrations
- Basic API: Not as robust as enterprise platforms
- No PowerBI/Tableau: Limited business intelligence tool connections
- No Payroll Processors: Beyond QuickBooks integration
Pricing
There is a one-time setup fee of $1,000-$3,000, depending on the company size and needs.
After that, the CrewTracks subscription includes unlimited training and support at no additional cost. Subscription cost is not publicly displayed on the website, need to contact the company for a quote.
Pros and Cons
Cons
- No biometric facial verification
- Relies on GPS + photo (both can be circumvented)
- Editable timesheets create accuracy vulnerability
- No fob option for workers without phones
- Requires cell service or WiFi (no built-in LTE)
- Not weatherproof (phone-dependent)
- No dedicated hardware option
- Device failure eliminates time tracking
- Limited multi-site real-time visibility
- Basic compliance features (no prevailing wage automation)
Pros
- Mobile app-based solution works on personal smartphones
- Quick deployment (under 1 week typical)
- Easy to use interface with minimal learning curve
- Equipment tracking included
- Flexible subscription terms
- Good value for smaller contractors (10-100 employees)
- Free trial available
Reviews
4.8/5
3.8/5
3.7/5
#7 - WorkMax (AboutTime) - Progress Reporting & Dashboards

Overview
WorkMax represents older technology acquired by Foundation Software. While it maintains a legacy of strong ERP integration, the product architecture reflects its age compared to modern mobile-first solutions.
Key Features Summary
- Multiple Clock-In Options
- Time Tracking & Timesheets
- Job Costing Integration
- Cost Code Tracking
- Union & Prevailing Wage Support
- Multiple Pay Types
- Legacy ERP Integration
- Web & Phone Access
- Timesheet Editing
Best For: Existing Foundation customers or contractors with established ERP integrations who prioritize system compatibility over modern user experience or advanced productivity analytics. Accept basic time-to-payroll without sophisticated efficiency measurement.
The Productivity Impact: Functions primarily as a time-to-payroll system for construction projects.
The platform moves hours into payroll systems with basic job costing visibility, but legacy reporting architecture limits the ability of construction teams to make data driven decisions or analyze productivity levels.
Organizations can see total hours per construction project but have limited ability to identify more profitable projects or understand where each project stands relative to estimates.
Overall Score
Criteria
Score
Key Features
- Multiple Clock-In Options: Web portal, phone line, and mobile app acces
- Time Tracking & Timesheets: PIN and password-based system
- Job Costing Integration: Links time with project costs
- Cost Code Tracking: Assign time to project phases and activities
- Union & Prevailing Wage Support: Handles certified payroll requirements
- Multiple Pay Types: Configure different pay rates and structures
- Legacy ERP Integration: Connects with Vista, Viewpoint Spectrum, and other systems
- Foundation Ecosystem: Strong integration with parent company platform
- Web & Phone Access: Multiple methods for workforce to report time
Productivity Analysis Features
- Cost code tracking provides basic visibility into labor allocation by construction project phase
- Job costing integration shows total labor costs per project, though detailed efficiency analysis is limited
- Multiple pay types support allows construction teams to track different labor classifications
- Union and prevailing wage features help main contractors maintain compliance while tracking labor costs
- Foundation ecosystem integration enables some cross-platform reporting for organizations using multiple Foundation products
Integrations
- Historic Strength: Integrates with most major construction ERPs
- Foundation Integration: Strong connection with parent company platform
- Vista & Viewpoint Spectrum: Established ERP connections
- Accounting Systems: Links with various accounting platforms
- Legacy API Available: Though not modern REST API architecture
- Limited Modern BI Tools: No PowerBI/Tableau native connections
- Complex Setup: Some integrations require middleware
- Foundation Ecosystem Lock-in: Ties primarily to parent company products
Pricing
Pricing is not publicly listed and requires contacting Foundation Software for a custom quote. Most plans are offered under contract rather than flexible month-to-month terms.
Pros and Cons
Cons
- No biometric verification whatsoever
- Legacy technology from pre-mobile era (10+ years old)
- Relies on PIN codes and passwords (easily shared for buddy punching)
- Editable timesheets with no verification
- Requires internet connectivity (no offline capability)
- Not purpose-built for field conditions
- No weatherproof hardware option
- No native daily reporting, safety, or quality modules
- No multi-site visibility dashboard
Pros
- Multiple access methods provide flexibility
- Proven with mid-sized contractors
- Multi-site capable
- Strong Foundation ecosystem integration if already using Foundation
- Union and prevailing wage support
- Historic ERP integration strength
- Used by established companies
- Cost code tracking functionality
Reviews
4.2/5
2.7/5
2.1/5
#8 - Archdesk - Construction ERP with Integrated Time Tracking
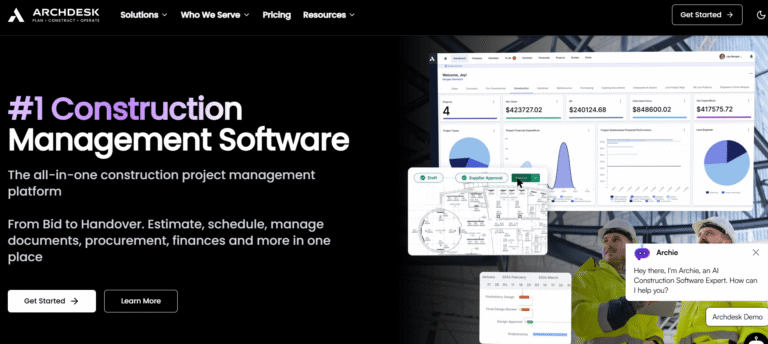
Overview
Archdesk is a UK-based construction ERP platform offering end-to-end business management from estimating through project completion. Time tracking represents one module within a comprehensive construction management software designed for contractors seeking unified management across all business functions.
Key Features Summary
- Mobile Time Clock
- GPS Tracking
- Geofencing
- Mobile Time Clock
- Photo Verification
- Kiosk Mode
- Scheduling
- Job Costing
- Time Off Tracking
Best For: Mid-to-large UK/EU contractors needing full ERP with basic time tracking as ONE component. Companies prioritizing centralized data management over specialized time accuracy. Can tolerate “mediocre” execution and “double entry” issues reported by users.
NOT For: US contractors needing biometric time tracking, specialty contractors focused on accurate field time, T&M billing requiring bulletproof documentation, anyone burned by oversold solutions.
The Productivity Impact: Provides job costing productivity analysis across the full ERP platform for construction projects.
Time data feeds real-time budget versus actual dashboards, enabling data driven decisions and creating cost productivity insights across multiple projects. Construction teams can track project progress and identify potential delays.
However, time accuracy limitations (absence of biometric verification, supervisor-led entry) may affect the reliability of productivity calculations and the ability to confidently identify more profitable projects. The downstream analysis reflects the quality of the source time data.
Overall Score
Criteria
Score
Key Features
- GPS-Enabled Timesheet Tracking: Location verification with time entries
- Multi-Level Approval Workflows: Configurable timesheet validation processes
- Automated Pay Rate Calculations: Handles different pay rates and conditions
- Comprehensive ERP Suite: Estimating, procurement, job costing, scheduling, document management, and asset tracking in one platform
- Budget vs. Actual Tracking: Real-time variance analysis across projects
- Cost Code Allocation: Assign time to projects and work packages
- Program Integration: Links with project schedules
- Multi-Project Dashboards: Centralized visibility across active work
- Cloud-Based Mobile Access: Timesheets and attendance accessible on tablets and smartphones
- Real-Time Data Synchronization: Updates flow between modules automatically
- Asset Tracking: Monitor equipment and tools across projects
Productivity Analysis Features
- Budget vs. actual tracking at project and cost code level reveals where each project stands and efficiency variances
- Multi-project dashboards enable construction teams to compare productivity levels and identify more profitable projects
- Cost allocation to work packages supports task-level productivity measurement, helping streamline workflows
- Real-time data synchronization provides same-day visibility into construction workers deployment efficiency
- Centralized data management provides security across multiple project stakeholders, saving time on manual data reconciliation
- Cloud-based mobile access helps main contractors maintain visibility into project progress from any location
Integrations
- Accounting Systems: QuickBooks, Xero, Sage (though users report Sage integration challenges)
- PowerBI: Available for reporting and analytics
- Limited Construction PM Integrations: No native Procore, Raken, or similar connections
- Export Capabilities: Can work with other accounting and ERP systems
- API Available: For custom connections though users report integration challenges
Pricing
Pros and Cons
Cons
- No biometric verification (GPS-based location only)
- Supervisor-led time entry remains common (not worker-led)
- Editable timesheets without identity verification
- Not purpose-built for field conditions (office-first design)
- Requires training (users report "not always intuitive")
- No weatherproof hardware option
- Creates "double entry" work instead of reducing it per user feedback
- System performance can be slow at scale
- No fob option for workers without phones
Pros
- All-in-one platform reduces need for multiple systems
- Real-time budget vs. actual tracking across projects
- Customizable dashboards for different roles
- Multi-project management capability
- Centralized data management
- Cloud-based with mobile access
Reviews
4.5/5
N/A
N/A
What is Production Tracking in Construction?
Production tracking in construction measures how efficiently resources – equipment, materials, and labor – convert into completed work. It represents the difference between knowing total labor expenditure and understanding whether those dollars delivered the estimated output.
For a $50M operation across ten jobsites without real-time production tracking, schedule adherence becomes uncertain. Meeting deadlines or falling behind relies more on assumption than data.
Production tracking provides three data points:
- Planned Performance: Estimated productivity rates from preconstruction
- Actual Performance: Real productivity measured in the field
- Variance Analysis: Where efficiency gains or losses occurred
Modern production tracking systems combine sensor data, verification technology, and automated capture to reduce estimation. Rather than spreadsheets updated days after work completion, or foremen approximating hours, systems can provide real-time data flowing from field to office without manual entry.
The Three Core Components of Construction Productivity Tracking
1. Employee Time Tracking
Labor typically represents 40-60% of total project costs for specialty contractors. It’s also the most challenging to track accurately and most vulnerable to data integrity issues.
What to Track:
- Actual Arrival/Departure Times: When workers clock in and out with verification (not supervisor estimates)
- Hours by Cost Code: Which project phases consumed labor hours and at what rates
- Crew Composition: Worker assignments across projects and phases
- Productivity Rates: Units completed per hour worked (yards poured, conduit installed, drywall finished)
- Overtime Patterns: Where overtime represents necessity versus where it signals scheduling issues
The Accuracy Challenge: Research indicates approximately 60% of contractors still rely on paper-based time tracking. This approach can result in time inflation averaging 15%. For a 500-employee contractor, this represents approximately $4.2 million annually in inflated labor costs.
Zero Manual Entry Architecture: Accurate time tracking systems eliminate manual entry completely. Workers verify identity through biometric systems at stationary devices or use geo-fenced mobile apps with flexible time entry options. Time flows automatically to dashboards and ERP systems. Cost codes get assigned efficiently rather than consuming hours of administrative time.
No phone dependency. No WiFi requirements. No buddy punching vulnerabilities. No foremen spending 90 minutes daily managing timesheets.
Multi-Site Operations: For contractors managing twenty jobsites across three states, time tracking systems should handle multi-state prevailing wage calculations, union versus non-union classifications, and automatic ERP integration – without creating administrative burden for field teams.
Workers verify identity. Systems handle complexity automatically across all general contractors and specialty contractor operations.
2. Equipment Tracking
Equipment productivity affects whether capital investments in machinery generate returns or represent ongoing expenses.
What to Track:
- Utilization Rates: Actual working hours versus idle time
- Fuel Consumption: Correlates with productivity and identifies operator efficiency variations
- Maintenance Schedules: Unplanned downtime impacts project timelines
- Location Data: Which jobsite has equipment and whether it’s properly deployed
The Productivity Impact: A concrete contractor managing fifteen sites discovered through tracking that three excavators sat idle 40% of the time due to scheduling gaps. Redeploying those owned and rented equipment resources added $180,000 in revenue without additional capital investment.
Implementation Approach: GPS telematics systems track location and runtime automatically. Effective implementation connects equipment data with project management platforms rather than maintaining separate dashboards.
3. Material Tracking
Material waste and delivery delays contribute to approximately 30% of cost overruns on commercial projects according to industry research. Measurement enables management.
What to Track:
- Delivery Performance: Scheduled versus actual arrival times
- Quantity Reconciliation: Ordered versus used materials
- Cost per Phase: Budget versus actual spending at granular level
- Waste Percentages: Industry standard runs 10-15%; higher rates indicate issues
The Productivity Connection: When a 25-person electrical crew arrives to find conduit delivery three days late, approximately $15,000 in labor costs accrue with minimal productive output. Material tracking helps prevent this scenario.
Material usage tracking minimizes waste by monitoring the movement, quantity, and status of materials from purchase to installation. This granular tracking helps construction companies identify actual quantities used versus ordered, reducing the industry-standard 10-15% waste percentage that signals procurement or handling issues.
Critical Distinction: Material tracking measures material flow and utilization. Time tracking measures labor deployment. Both feed job costing, but require different capture methods and serve different analytical purposes.
Before settling on a time tracking solution for your construction business, check out our guide to 11 best construction time tracking software.

Key Features to Look for in Productivity Tracking Software
Data Accuracy & Integrity (The Foundation)
This represents the foundational requirement. FMI’s 2023 Labor Productivity Study indicates contractors estimate 11% to 15% of field labor costs represent waste or unproductive time – approximately $30 billion to $40 billion in annual losses across the U.S. construction industry.
Inaccurate time tracking often serves as the primary contributing factor.
Requirements:
- Face-match Technology: Systems that prevent buddy punching. Not photo timestamps workers can provide from elsewhere. Not fingerprint systems that fail with gloves or welded hands. Verification technology that functions reliably in construction conditions.
- Real-Time Capture: Eliminates end-of-day estimates. Data enters systems when workers clock in, not when supervisors complete timesheets Friday afternoon.
- Automated Cost Code Processing: Zero manual data entry. Workers clock in, the system assigns appropriate cost code and phase based on schedule. One-click adjustments when needed.
- Location Verification: Geo-fencing confirms physical presence at jobsite. GPS tracking alone may allow remote check-ins from parking areas.
Real-Time Visibility Across Multiple Sites
Enterprise contractors typically manage 10, 20, or 50 simultaneous projects across multiple states rather than single locations.
Requirements:
- Live Dashboards: Current headcount, labor deployment, and budget performance across all projects with real time insights. Not yesterday’s data.
- Site-Level Detail: Total company view with drill-down capability to individual projects, specific crews, and worker-level information.
- Variance Alerts: Notifications when labor costs deviate from budget thresholds. Identify issues at 10% variance rather than discovering 30% overruns later.
Integration Capabilities
Standalone systems create data silos and require manual data entry between platforms.
Requirements:
- Native ERP Integration: Direct data flow to Procore, Foundation, Viewpoint Vista, CMiC rather than CSV exports requiring manual import.
- Payroll Automation: Time data flows directly to payroll processing without spreadsheet manipulation.
- Business Intelligence Compatibility: PowerBI and Tableau connectivity for advanced analytics and customizable reporting.
Scalability Considerations
Software functioning well for 50 workers may not handle 500 workers effectively.
Requirements:
- Multi-State Compliance: Automatic prevailing wage calculations, union versus non-union classifications, varying labor law requirements across jurisdictions.
- Unlimited Growth Support: No per-site licensing fees that make expansion prohibitively expensive. Look for unlimited device pricing.
- Complex Workforce Management: Handle direct employees, temp agency labor, and hourly subcontractors within unified systems.
Field Adoption Factors
Sophisticated software provides limited value if field teams won’t use it consistently.
Requirements:
- Excuse-Free Operation: Functions without phone, WiFi, or data connectivity. Minimal training requirements. Under 60 seconds to begin using.
- Weather-Resistant Hardware: Operates in rain, dust, extreme temperatures – actual construction conditions rather than office environments.
- Multiple Check-In Methods: Hardware for large crews (20+ workers), mobile functionality for smaller teams, fobs for workers without phones.
Feature Category | Why It Matters for Multi-Site Operations | What to Look For |
Time Tracking Accuracy | Foundation for reliable productivity metrics; 11-15% waste if inaccurate | Face-match technology, geo-fencing, real-time capture, self-learning systems |
Cost Code Tracking | Job costing accuracy drives profitability | One-click assignment, carry-over capability, unlimited codes, cost splitting |
Multi-Site Management | Enterprise scalability and full visibility | Real-time dashboard, site-by-site visibility, consolidated reporting, variance alerts |
ERP Integration | Eliminates manual entry waste (800+ hours annually) | Native integrations with major platforms, not CSV exports |
Field Usability | Drives adoption rates for project teams | Excuse-free check-in, functions without phone/WiFi, <60 second start time |
Scalability | Growth without system replacement needs | Multi-state compliance, unlimited sites, temp labor management |

How to Track Productivity on Construction Sites
1. Deploy Real-Time Capture Systems
Manual data entry – spreadsheets, clipboard timesheets, end-of-day reporting – creates three systematic issues:
- Time Lag: Problems become apparent days after occurrence when correction opportunities have passed
- Inaccuracy: Manual entry typically shows 15-20% error rates
- Administrative Burden: Foremen spend hours on administration rather than leading crews
Alternative Approach: Automated capture systems – biometric time clocks, RFID tags – collect data continuously. Workers verify identity with facial verification. Equipment transmits location automatically. Materials get scanned upon delivery.
Real-time data enables real-time decision-making. Identifying crew performance issues today allows labor redeployment today rather than discovering problems next week when budget impacts have already occurred.
2. Integrate Your Data Sources
Equipment tracking in one system. Material tracking in another. Time tracking elsewhere. ERP in a fourth platform.
Data fragmentation undermines productivity analysis. Understanding relationships between labor hours, equipment utilization, and material delivery becomes difficult when data exists in separate silos.
Zero-Touch Data Flow Architecture: The most effective approach builds data architectures where field → payroll → ERP happens automatically:
- Time tracking feeds payroll with structured data rather than manual entry
- Payroll feeds job costing with actual hours by cost code
- Job costing feeds analytics platforms for productivity trends across all projects
One data warehouse. One source of truth providing accurate data for informed decisions.
3. Track at Granular Level
Project-level productivity data typically lacks actionable detail. “5% over budget on labor” provides limited guidance.
Track at Cost Code Level:
- Which specific activities run over or under productivity targets?
- Which crews consistently outperform others on identical work?
- Which supervisors manage labor costs effectively versus those who don’t?
Example: A drywall contractor discovered through granular tracking that hanging crews achieved 95% of productivity targets while finishing crews reached only 72%. The challenge wasn’t installation techniques – finishing approaches and crew composition needed adjustment. Training and staffing changes addressed the gap.
4. Measure What Matters to Your Trade
Electrical contractors measure conduit installation per hour. Concrete contractors measure yards poured per worker-day. Solar contractors measure panels installed per crew-week.
Productivity tracking should measure units of completed work beyond hours logged. SmartBarrel integrates with systems tracking both time AND output, providing true productivity rates for project outcomes.
5. Build Comparison Baselines
Productivity data requires context. Whether 150 linear feet of conduit per electrician-day represents strong or weak performance depends on baselines:
- Historical Data: How did this crew perform on similar past projects?
- Estimated Productivity: What did estimators assume for this phase?
- Industry Benchmarks: Where does performance rank versus regional competitors?
Tracking productivity across projects builds institutional knowledge. Estimating improves. Bidding accuracy increases. Margins strengthen on future jobs.
6. Connect Verified Time to Actual Production Output
Time tracking logs hours worked. Productivity tracking connects that time to actual output or installed quantities. The most effective productivity systems eliminate the gap between these two data points:
- Workers verify time through biometric systems (accurate labor input)
- Teams log production quantities in the field (actual output)
- Systems automatically calculate productivity rates (output ÷ input)
- Real-time dashboards show performance against estimates
For example, rather than just knowing your concrete crew worked 48 hours this week, you can see they poured 180 yards – revealing a productivity rate of 3.75 yards per hour. Compare that to your estimated 4.0 yards per hour, and you’ve identified a specific 6% efficiency gap worth investigating.
This connection between verified time and measured production transforms raw data into actionable productivity intelligence.
Why is Productivity Tracking Important in Construction?
Construction operates on margins typically too thin to accommodate guesswork.
The Financial Reality:
- Average contractor net margin: 1.5-3%
- Labor cost as percentage of revenue: 40-60%
- Time inflation percentage from manual tracking: 10-15%
For a $50M annual revenue contractor:
- $25M in labor costs
- 12% time inflation = $3M in excess labor spend
- Net margin elimination
Every hour claimed should represent an hour worked. Every dollar spent should deliver expected output rather than representing wasted time.
Beyond Theft Prevention – Operational Optimization:
Even accurate time reporting can reveal unproductive patterns. Waiting on materials. Equipment breakdowns. Scheduling gaps. Weather delays. These don’t represent theft – they’re operational inefficiencies that productivity tracking exposes.
Competitive Positioning:
Competitors who track progress systematically know their true costs. They bid accurately and profitably. Without systematic tracking, estimates rely on assumptions. Sometimes bids win profitably. Sometimes they result in losses.
Which company survives economic downturns more effectively?
Audit Defense Capability:
T&M contracts require documentation. When general contractors dispute 200 hours on invoices, what evidence exists beyond “our foreman’s timesheet”?
Biometric facial verification combined with geo-fencing and timestamp documentation provides audit-proof records that withstand client disputes and support claims.
Benefits of Productivity Tracking in Construction
Increased Profitability
Time theft alone costs contractors approximately $4,285+ per worker annually. Across 500 workers, this represents $2.1M in losses through buddy punching, time inflation, and unverified hours.
Eliminating time theft improves profit margins without requiring revenue increases – it stops financial losses.
Operational efficiency improvements deliver larger gains:
- Identify underperforming crews before budget impacts compound
- Redeploy labor from slow sites to behind-schedule locations
- Catch procurement delays before they halt production
- Determine which supervisors manage costs effectively
Improved Customer Satisfaction
Schedule overruns damage client relationships significantly. Improved customer satisfaction results from tracking productivity because it helps ensure projects stay on schedule and meet quality standards – not just project completion but quality of execution.
Productivity tracking provides early warning indicators:
- Which tasks run behind schedule
- Which crews need additional support
- Where material delays threaten critical path activities
Course correction becomes possible before missing contractual deadlines.
T&M Advantage:
For time-and-material contracts, productivity tracking provides transparent documentation. When clients review biometrically verified hours with timestamps and location data, disputes typically decrease.
Fewer Warranty Defects
Rushed work creates defects. Defects generate callbacks. Callbacks eliminate margins. Tracking productivity allows project managers to identify errors and issues in a timely manner, catching problems during construction rather than discovering them after project handover when correction costs multiply.
Productivity tracking identifies when crews rush to meet schedules – before quality suffers.
Promotes Accountability and Transparency with Subcontractors
Many contractors operate with complex workforce structures – combining direct employees, temporary labor from staffing agencies, and hourly subcontractors on the same projects. Each group may operate under different payment structures and contractual arrangements.
The Structural Challenge: Different workforce segments have different billing mechanisms. Direct employees typically receive fixed salaries or hourly rates. Temp agencies bill for workers they supply. Hourly subcontractors invoice based on time worked. Without verified time data, reconciling these different billing methods and confirming actual hours worked across all groups becomes administratively complex.
The Solution: Biometric verification with geo-fencing creates a single, consistent time capture system across all workforce segments. Workers verify identity on-site regardless of employment classification. Time data flows to the appropriate billing or payroll system automatically.
This approach provides several benefits:
Consistent Data Collection: All workers – regardless of employment type – check in using the same verification method
Simplified Billing Reconciliation: Verified time stamps eliminate questions about hours worked for T&M billing
Reduced Administrative Overhead: No need to reconcile different time capture methods across workforce segments
Transparent Documentation: Facial verification with location data provides audit-ready records for all parties
When all workforce segments use verified time capture, billing disputes typically decrease. The system confirms who worked, where they worked, and for how long – creating a shared dataset that supports accurate invoicing and payment processing across complex workforce structures.
Evaluation of Work Completion at Multiple Levels
Productivity tracking enables performance analysis at every organizational level:
- Project Level: Overall budget versus actual, schedule adherence, profitability
- Phase Level: Which cost codes ran over or under estimates
- Crew Level: Which teams consistently outperform or underperform
- Individual Level: Which workers show tardiness patterns, early departures, or miss productivity targets
- Supervisor Level: Which foremen manage labor costs effectively versus those who allow cost overruns
This granularity transforms management approaches:
- Recognize and reward high performers
- Provide training for underperformers
- Address chronic performance issues
- Refine estimating based on actual historical productivity
How to Improve Your Production Tracking
1. Audit Your Current Data Quality
Before improving production tracking, assess current capture quality:
Assessment Questions:
- How long after work performance do we capture hours?
- What’s our error rate on manual time entry?
- Can we verify workers were physically on-site when claimed?
- Do we track hours at cost code level or only project totals?
- How much time do supervisors spend on timesheets versus managing crews?
2. Eliminate Manual Entry
Manual data entry creates three persistent problems: errors accumulate (industry average runs 15-20%), data arrives late (typically 3-7 days after work is performed), and supervisors spend time on administration instead of managing crews.
Zero manual entry systems work differently. Workers verify identity at a device – facial scan or fob. Mobile crews use geo-fenced apps. Time flows directly to dashboards without anyone typing hours or reconstructing yesterday’s shift from memory.
One superintendent described the change: “I used to spend two hours every Friday on timesheets. Now I spend five minutes approving pre-populated data.”
That’s the goal – accurate time without the administrative work.
3. Integrate Time Tracking with Job Costing
Time tracking and job costing should integrate seamlessly or represent unified systems.
The Workflow:
- Workers clock in/out with face-match technology
- Supervisor assigns cost codes efficiently (minutes not hours)
- Time flows automatically to payroll
- Payroll data feeds job costing without manual transfer
- Job costing updates project budgets in real-time
No double entry. No spreadsheet exports. No manual reconciliation creating delays and errors.
For Enterprise Operations: Multi-state contractors need systems handling prevailing wage calculations, union classifications, and ERP integration automatically. Workers still verify identity with a simple scan. Systems handle regulatory complexity invisibly.
4. Build Real-Time Visibility Across All Sites
Managing twenty jobsites should provide labor data from all twenty sites on a single dashboard – updated in real-time rather than awaiting next week’s reports.
Track Live:
- Current headcount per site
- Hours worked today and this week
- Budget versus actual by cost code
- Crew assignments across sites
- Tardiness and early departure patterns
5. Train Your Team on Data Usage (Not Just Data Entry)
Field teams don’t need training on facial verification – that typically takes 30 seconds to learn.
They need training on using productivity data:
For Foremen:
- Reading productivity variance reports
- Identifying crew performance trends
- Using data in crew performance discussions
For Project Managers:
- Spotting cost code overruns early
- Comparing crew productivity across projects
- Using data in change order justification
For Executives:
- Analyzing company-wide productivity trends
- Identifying systematic problems versus project-specific issues
- Refining estimating based on actual historical data
Data without interpretation represents noise. Training teams to extract insights converts raw information into actionable intelligence.
6. Invest in Solutions That Scale
Managing 200 workers today with plans to grow to 500 requires productivity tracking systems that handle growth without breaking.
Scale Requirements:
- Unlimited devices/sites without per-device pricing that penalizes growth
- Multi-state prevailing wage and union handling
- API integrations with ERP and project management platforms
- Real-time data across all locations
- Support for complex workforce structures (W-2, temp labor, hourly subs)
One site or thirty sites. 100 workers or 2,000 workers. Same accuracy. Same field simplicity regardless of scale.
7. Establish Clear Productivity Metrics Across Operations
Define which productivity metrics matter most to your operations and track them consistently:
- For specialty contractors: Units installed per labor hour (conduit per electrician-hour, square feet per drywall crew-day)
- For concrete contractors: Cubic yards poured per worker-day, placing and finishing rates
- For MEP contractors: Installed quantities versus labor budget by system and phase
The goal isn’t tracking every possible metric – it’s consistently measuring the metrics that drive profitability in your specific trade. Tools that verify time at the source and connect it to installed production deliver the most reliable productivity insight, enabling teams to see actionable trends within the first week rather than waiting for month-end reports.
Challenges in Construction Productivity Measurement
Challenge 1: Field Conditions Destroy Consumer-Grade Technology
iPads don’t survive typical jobsites. Fingerprint scanners fail when workers wear gloves or have welded fingertips. WiFi doesn’t reach underground parking structures or basement levels.
The Solution: Industrial-grade hardware designed for construction environments. Weatherproof construction. Magnetic mounting. Built-in LTE connectivity rather than WiFi dependence. Functions in rain, dust, extreme temperatures.
An identity verification technology that works with gloves, dirty faces, and any other conditions workers encounter.
Challenge 2: Workers Resist New Systems
A new time tracking system gets deployed. Adoption starts strong but drops off. Three months later, crews have reverted to clipboards.
Workers resist for predictable reasons: the system’s too complicated, it requires their personal phone, it doesn’t work reliably, or it feels like surveillance rather than a tool that makes their job easier.
The solution isn’t better training – it’s better design. Systems that work get adopted. Workers start using them in under 60 seconds without training. They don’t require phones (fobs work fine). They function reliably every time in any weather. And they’re obviously there to handle timesheet admin, not monitor bathroom breaks.
When a system proves easier than a clipboard, adoption typically follows naturally.
Challenge 3: Data Lives in Silos
Time tracking in one system. Payroll in another. Job costing in a third platform. Equipment tracking in the fourth system.
Analyzing productivity becomes impossible when data doesn’t connect.
The Solution: Integration architecture. Time tracking integrates with Procore, Foundation, Vista, CMiC, PowerBI. Data flows automatically between systems.
Build technology stacks around data architecture rather than around individual tools in isolation.
Challenge 4: Lack of Real-Time Data
Analyzing last week’s productivity this week resembles driving while looking in the rearview mirror.
By the time crew performance issues become apparent, budget damage has already occurred.
The Requirement: Real-time data from field. Not offline sync waiting for WiFi connection. Not “when you return to office.” Now.
Built-in LTE connectivity delivers time data instantly. Identify problems as they develop rather than after margin destruction.
Challenge 5: Difficulty Measuring Output (Not Just Input)
Hours worked (input) doesn’t equal productivity without measuring output.
Ten hours installing conduit means nothing without knowing conduit footage installed.
The Productivity Equation: Productivity = Output / Input
Both numbers are required.
The solution: SmartBarrel delivers the input side with bulletproof accuracy – biometrically verified hours with zero manual entry. That’s half the equation solved.
For output, contractors track units through foreman daily reports, Procore daily logs, or production tracking tools. Combine SmartBarrel’s accurate time data with unit tracking and you get real productivity rates: 150 feet of conduit / 8 electrician-hours = 18.75 feet per hour.
The foundation: you can’t calculate meaningful productivity with bad time data. If hours are inflated 15% through buddy punching, your productivity calculations are fiction regardless of how accurately you track output. Fix the time data first.
Challenge 6: Resistance from Supervisors Controlling Timesheets
Supervisors who manage timesheets handle two different jobs: leading their crew and tracking everyone’s hours. These roles sometimes conflict.
When supervisors control timesheet approval, they make judgment calls – about disputed hours, late arrivals, early departures. They balance keeping the crew motivated against keeping labor costs accurate. It’s a difficult position.
Automated time tracking shifts this dynamic. Workers verify their own time. The system generates timesheets based on actual check-ins and check-outs. Supervisors review and approve in minutes rather than creating timesheets from scratch.
This changes the supervisor’s role from timekeeper to crew leader. Less time on administrative work. More time on the work itself.
FAQs About Construction Productivity Tracking
What's the difference between time tracking and productivity tracking?
Time tracking logs hours worked. Productivity tracking connects that time to actual output or installed quantities. You need both – verified hours provide the denominator, installed quantities provide the numerator, and together they reveal true efficiency rates.
Do I need field adoption for productivity tracking tools?
Yes – productivity systems fail if crews don’t use them daily. The most successful implementations use tools that require minimal training (under 60 seconds to start), work in all field conditions, and don’t create extra administrative burden. When workers can verify time and log production in the same simple workflow, adoption follows naturally.
How quickly can I start seeing productivity insights?
With tools that verify time and log production daily, most teams see actionable trends within the first week. Real-time data flow eliminates the typical lag where problems compound before anyone notices. Compare this to month-end reporting cycles where efficiency issues get discovered weeks after they’ve already impacted margins.
How accurate does time tracking need to be for productivity software to actually work?
Time tracking accuracy should remain within 15 minutes per worker per day for productivity software to deliver meaningful insights. Greater variance undermines data reliability.
Manual time tracking shows documented error rates of 15-20% – meaning approximately one in five hours recorded contains inaccuracies. For 200 workers, 30 minutes daily error represents 26,000 hours of inaccurate data annually flowing into job costing and estimates.
For productivity software to function effectively, 95%+ accuracy becomes necessary. Zero manual entry with biometric facial verification eliminates human memory, manual entry, and fraud from the process completely.
What is the difference between manual vs digital construction productivity tracking methods?
Manual tracking relies on clipboards, paper timesheets, and human memory. Workers estimate hours at week’s end. By the time management reviews productivity metrics, data is 5-10 days old and contains 15-20% errors.
Digital tracking employs automated capture – biometric time clocks, geo-fenced apps – collecting data continuously without human intervention. Time flows automatically to dashboards in real-time, enabling management to identify problems while correction remains possible.
Accuracy differences prove substantial: manual methods average 15-20% error rates from buddy punching and transcription mistakes. Digital biometric systems achieve 95%+ accuracy because verification happens at the source. Digital tracking also saves 800+ hours annually that supervisors previously spent on timesheet administration.
What is the impact of technology on construction productivity?
Technology’s impact on construction productivity presents a paradox: tools exist to transform operations, but adoption lags significantly. Construction productivity has grown only 1% annually over the past two decades while manufacturing grew 3.6% annually.
When deployed appropriately, gains prove substantial. Automated time tracking eliminates 800+ hours annually spent on manual timesheets. Real-time job costing identifies cost overruns within hours instead of weeks.
The challenge isn’t technology capability – it’s field adoption. Technology only improves productivity when it survives construction reality: weatherproof hardware, built-in LTE, facial verification functioning in any condition, zero training requirements.
What are the KPIs in construction?
Construction KPIs cluster around five categories: financial performance, schedule adherence, quality control, safety, and labor productivity.
Financial KPIs: Gross and net margin, job cost variance (estimated versus actual by cost code), cash flow metrics
Schedule KPIs: Schedule variance, on-time completion percentage, critical path adherence
Quality KPIs: Callback rate, punch list item count, warranty claim frequency
Safety KPIs: Total Recordable Incident Rate (TRIR), Days Away Restricted or Transferred (DART) rate, Experience Modification Rate (EMR)
Labor Productivity KPIs: Units completed per labor hour, labor cost per unit, overtime percentage, budget versus actual labor hours by cost code – where most contractors maintain weakest data due to manual time tracking producing unreliable inputs.
How do you measure productivity in construction?
Productivity in construction is measured by dividing output (units of completed work) by input (labor hours, equipment hours, or dollars spent).
Basic formula: Productivity = Output / Input.
Example: 150 linear feet of conduit installed / 8 electrician-hours = 18.75 feet per hour. Comparing that rate to estimates (say 20 feet per hour) reveals 6% under productivity targets.
Measurement focus depends on trade: Electrical contractors track conduit per hour. Concrete contractors track cubic yards per worker-day. Drywall contractors track square feet per crew-week. The specific units matter less than consistency – measuring the same way across all projects enables comparison.
Critical requirement: accurate time data. Biometric time tracking eliminating fraud provides real labor hours. Combining this with output tracking reveals true productivity rates, enabling refined estimates and elimination of guesswork from bidding.
Detailed Scoring Breakdown
#1. SmartBarrel - Overall Score: 97/100 - OUTSTANDING
The Bottom Line
SmartBarrel is designed to provide verified field time data, which is essential for reliable productivity measurement. Built by someone who spent 10+ years working in construction, not dreamed up in a corporate office.
The Productivity Impact: Foundation of accurate productivity metrics. Biometric facial verification ensures you’re measuring actual work hours, not inflated/fraudulent time. If a crew reports 40 hours but only worked 32, your productivity calculation is off by 20%. $4,285+ saved per worker annually = eliminating unproductive/fraudulent hours from your calculations.
Score Breakdown:
Time Accuracy & Fraud Prevention: 20/20
- Biometric facial verification (AI-powered, self-learning system)
- Green/red circle verification prevents buddy punching
- No photoshoot required – system learns workers automatically
- Self-registered fobs for workers without phone numbers
- Real-time data capture with tamper-proof audit trails
Why it matters for productivity: Accurate TIME input = accurate productivity output. Other solutions allow fraud to slip through, undermining efficiency calculations.
Field Readiness & Deployment: 20/20
- Set up and running in under 1 minute
- Works in ALL conditions: gloves, welded fingerprints, no phone needed
- WeatherProof TimeClock 4.0 hardware (solar or electric powered)
- Built-in LTE – zero WiFi dependency
- Magnetic mounting – lives on jobsite permanently
- Purpose-built for harsh construction environments
Why it matters for productivity: If workers can’t clock in because a device died or WiFi’s down, you’re missing productivity data for entire shifts.
Construction-Specific Features: 18/20
- One-click cost code assignments with splitting capability
- Automatic lunch break and rounding rules by jobsite
- Carry-over cost codes
- Live headcount across all projects
- Multi-company structure support (own employees, temp labor, hourly subs)
- Union contractor features (5/8s, 4/10s tracking)
- T&M backup documentation with facial verification
- Multi-site operations with real-time visibility
Gap: 2 points deducted because no native scheduling/dispatch module, no native equipment tracking,
Why it matters for productivity: Cost codes = productivity by task. You can measure concrete crew productivity vs electrical crew productivity with accurate time allocation.
Integration Ecosystem: 14/15
- Native integrations: Procore (Timesheets, Timecards, Daily Logs), CMiC (eTime & timesheets), Viewpoint Vista (Timesheets), PowerBI, Plexxis
- Compatible systems: Viewpoint Vista & Spectrum, Acumatica, CMiC, ECCS, QuickBooks Online & Desktop, Foundation, ComputerEASE, Jonas, COINS
- Integrations in development: Foundation, Acumatica, Viewpoint Spectrum, Sage Intacct
- Direct payroll system connections
Minor gap: Some major integrations are still in development, 1 point deducted
Why it matters for productivity: Time feeds your business intelligence tools for productivity dashboards and predictive analytics.
Scalability: 15/15
- Proven 100-5,000+ workers
- Multi-site operations (documented success with 50+ jobsites)
- Multi-state operations with automatic prevailing wage
- Geographic expansion: Works nationwide (48 states + territories)
- Unlimited devices per account
Why it matters for productivity: Measure productivity across your entire operation, not just one jobsite.
User Experience & Support: 5/5
- Mobile apps: 4.7/5 iOS, 4.1/5 Android
- “Set up in under 60 seconds” – verified by customer testimonials
- Workers use it without training
- Removes timekeeper burden from foremen
- 24/7 customer support (not tiered, not hidden)
- Consistently praised for ease of use
Why it matters for productivity: If workers won’t use it, you get no data. If foremen spend hours fixing timesheets, that’s unproductive time.
Value & Transparency: 4/5
- ROI documented: $4,285+ saved per worker annually
- 800+ hours saved on manual entry
- Pays for itself in first month
- No hidden costs, includes hardware + software
- Month-to-month options available
Gap: 1 point deducted because pricing is not publicly listed and requires a sales conversation.
What Makes SmartBarrel Different:
- NO photoshoot required – System self-learns workers in real-time
- NO phone needed – Self-registered fobs work for anyone
- NO WiFi needed – Built-in LTE works anywhere
- NO training – Workers start in under 60 seconds
- Hardware + Mobile – Only solution built for 50+ workers per site with mobile flexibility
#2. Planera - Overall Score: 84/100 - VERY GOOD
The Bottom Line
Planera brings rigor and real-time collaboration to construction scheduling – replacing legacy tools like Primavera P6 and Microsoft Project with a modern, visual CPM environment. Where time tracking tells you what happened, scheduling tells you what should happen. Poor schedule quality costs the industry billions in rework, trade conflicts, and missed milestones. Planera attacks that directly by making scheduling a living process rather than a static document.
Score Breakdown:
Schedule Logic & Accuracy: 19/20
- Full CPM scheduling with drag-and-drop visual interface
- Built-in DCMA quality checks to catch missing logic and excessive constraints
- Risk and scenario analysis to model downstream impacts before committing
- Progress tracking with version comparison and S-curve baseline visualization
Gap: 1 point deducted – no native Monte Carlo or probabilistic risk quantification, which mature scheduling operations often require.
Why it matters for productivity: A schedule with broken logic gives false confidence. Planera’s built-in quality checks ensure the critical path you’re managing is actually the critical path — leading to better resource decisions and more reliable delivery.
Field Readiness & Deployment: 14/20
- Master and field schedule alignment keeps look-aheads connected to long-term milestones
- Real-time collaboration so field and office work from the same source of truth
- Cloud-based – no installation, accessible from any device
Gap: 6 points deducted — Planera is a planning tool, not a field-first solution. No offline mode, no hardware, and field adoption depends heavily on team discipline rather than the tool itself.
Why it matters for productivity: Planera keeps the planning layer sharp, but closing the loop between field execution and schedule updates still depends on your team’s process more than the software.
Construction-Specific Planning: 20/20
- Purpose-built for construction CPM – not adapted from generic project management software
- PPC tracking for lean construction and pull planning workflows
- Master and look-ahead schedule alignment built into the product design
- Multi-project dashboards for portfolio-level performance visibility
Why it matters for productivity: Planera speaks construction scheduling natively – CPM logic, phase planning, trade sequencing, look-aheads — so schedulers spend time on planning decisions, not fighting the software.
Integration Ecosystem: 13/15
- Imports/exports from Primavera P6, Microsoft Project, and Excel
- API support for custom data connections
- Works alongside major construction management platforms
Gap: 2 points deducted – no documented native bi-directional integrations with Procore, CMiC, or Viewpoint out of the box. Custom API work may be required for full connectivity.
Why it matters for productivity: A schedule isolated from the rest of your project data creates manual reconciliation work and slows down performance reporting.
Scalability: 14/15
- Unlimited users – no per-seat barrier to adoption
- Multi-project visibility for portfolio-level oversight
- Cloud architecture scales without hardware or IT overhead
Gap: 1 point deducted – enterprise-level deployment details (multi-region, SSO, admin controls at scale) are not prominently documented.
Why it matters for productivity: Productivity becomes strategic when you can see patterns across projects. Planera’s multi-project visibility means schedule performance data isn’t siloed to a single jobsite.
User Experience & Support: 2/5
- Visual drag-and-drop interface reduces the P6 learning curve
- Cloud-based removes installation and version management friction
Gap: 3 points deducted – requires consistent team participation to deliver value. Support depth, onboarding detail, and app store ratings are not documented at the level of more established tools.
Why it matters for productivity: Scheduling software only works if the team uses it consistently. Tools that require heavy change management create adoption drag that offsets their intended value.
Value & Transparency: 2/5
- Unlimited users included – strong value for large teams
- Optional onboarding and professional services available
Gap: 3 points deducted – no public pricing, no published ROI data or case study metrics. Buyers can’t self-qualify on value without a sales conversation.
Why it matters for productivity: Procurement friction slows adoption. Every week a better scheduling tool isn’t in use is another week of schedule risk going undetected.
#3. Procore - Overall Score: 78/100 - VERY GOOD
The Bottom Line
The 800-pound gorilla of construction software. Phenomenal project management platform with enterprise productivity dashboards, but time tracking is an add-on feature, not the core strength.
The Productivity Impact: Enterprise productivity ecosystem. Time feeds comprehensive dashboards connecting labor → budget → schedule → costs. Can measure on-time performance, cost per unit, labor efficiency trends.
Gap: Time accuracy issues mean productivity calculations may be unreliable – garbage in, garbage out.
Score Breakdown:
Time Accuracy & Fraud Prevention: 10/20
- GPS geofencing available
- Photo capture on clock-in (not biometric verification)
- Audit trails for timesheet changes
Gap: 10 points deducted because no biometric facial verification (relies on honor system + GPS), manual timesheet entry by crew leads is common standard practice, time can be edited/adjusted after submission without verification, photo capture doesn’t prevent buddy punching (can show any photo), no fob option for workers without phones
Field Readiness & Deployment: 12/20
- Mobile apps work well in field conditions
- Works on personal phones or tablets
- Works offline with sync when reconnected
Gap: 8 points deducted because requires internet connectivity (WiFi or cellular) for real-time data, not weatherproof (phone/tablet dependent), setup requires significant configuration and training (multi-week implementation typical), no dedicated hardware option means if device dies/breaks you lose time tracking capability
Construction-Specific Features: 20/20
- Comprehensive project management suite
- Cost code tracking and productivity insights
- Daily logs, safety, quality, RFIs, submittals
- Resource planning and workforce allocation
- T&M ticket generation
- Multi-site project portfolio management
- BIM coordination and model viewer
- Change order management
Integration Ecosystem: 14/15
- 500+ integrations in App Marketplace
- Native connections to major ERPs, accounting systems
- Robust API for custom integrations
- Connects to virtually any construction software
Gap: 1 point deducted because some integrations require additional fees, middleware sometimes needed for complex ERP connections
Scalability: 15/15
- Proven at enterprise scale (Fortune 500 contractors)
- 3 million+ projects managed globally
- Multi-region, multi-state operations
- Unlimited users and projects
- Used by largest GCs and owners worldwide
User Experience & Support: 5/5
- Mobile apps: 4.7/5 iOS, 4.1/5 Android
- 24/7 support, extensive training resources
- Procore University and certifications
- Strong user community
- Award-winning customer success programs
Value & Transparency: 2/5
- Extensive training resources included
- Strong customer success programs
Gap: 3 points deducted because pricing not publicly disclosed (complete opacity), “request demo” required for any pricing information, higher cost point (typically $10K+ annually), implementation requires significant additional investment, contract commitments typically required (not month-to-month)
#4. Raken - Overall Score: 73/100 - VERY GOOD
The Bottom Line
Daily reporting champions with solid time tracking features. Great for production documentation and compliance, but time tracking requires more manual input than specialized solutions.
The Productivity Impact: Daily production documentation. Connects time WITH production logs: “Poured 50 yards concrete with 8 workers in 6 hours” = productivity metric. Weather documentation shows environmental impact. Gap: Supervisor-led time entry may inflate hours by 5-15%, deflating true productivity numbers.
Score Breakdown:
Time Accuracy & Fraud Prevention: 12/20
- AI photo ID verification (requires photos uploaded beforehand)
- Kiosk mode + personal time tracking options
- Custom clock-in/out questions to verify presence
Gap: 8 points deducted because photo system requires pre-loading worker photos (no self-learning system), no true biometric facial verification (comparison-based only), manual timesheet approval process allows supervisor override, no fob option for workers without phones/photos, photos can be circumvented with buddy punching if not monitored closely
Field Readiness & Deployment: 15/20
- Mobile-first design works well in field
- Offline functionality caches last 5 projects
- Works in field conditions with company devices
- Quick deployment, minimal training
Gap: 5 points deducted because requires smartphones or tablets (no dedicated hardware), not weatherproof (device-dependent), limited offline access (only 5 projects cached), requires pre-loading worker photos which adds setup time, device dies = no time tracking
Construction-Specific Features: 17/20
- Outstanding daily reporting capabilities
- Safety management with 100+ pre-built templates
- Quality control checklists and inspections
- Cost code tracking and production metrics
- Time tracking with custom payroll policies
- Weather documentation
- Subcontractor collaboration (Super Dailies)
Gap: 3 points deducted because no native shift scheduling/dispatch, limited workforce planning features, no equipment tracking module
Integration Ecosystem: 11/15
- Accounting & payroll integrations (QuickBooks, ADP, Paychex)
- Project management connections (Procore, PlanGrid)
- Cloud storage integrations (Box, Dropbox)
- Reality capture tools
Gap: 4 points deducted because fewer native integrations than Procore/SmartBarrel, limited ERP connections (no Vista, CMiC, Foundation), no PowerBI/Tableau native integration, API less robust than leaders
Scalability: 12/15
- Proven for mid-market to enterprise (100-1,000+ employees)
- Multi-site operations supported
- Used by 30,000+ contractors
- Works for GCs and specialty contractors
Gap: 3 points deducted because less documentation for 2,000+ worker operations, photo pre-loading becomes more complex at scale, offline limitation (5 projects) problematic for large multi-site operations
User Experience & Support: 5/5
- Mobile apps highly rated
- “No training required” positioning
- Award-winning onboarding
- Strong customer support (866-438-0646)
- Active user community
- Consistently praised for ease of use
Value & Transparency: 1/5
- Free trial offered
Gap: 4 points deducted because pricing not clearly published (complete opacity), “request demo” required for any pricing information, no month-to-month option mentioned, mid-market pricing point not disclosed, no documented ROI calculations provided.
#5. Fieldwire - Overall Score: 72/100 - GOOD
The Bottom Line
Field-office coordination champion (owned by Hilti) focused on plan viewing, task management, and punch lists. Not purpose-built for time tracking or productivity measurement.
The Productivity Impact: Task productivity, not labor productivity. Measures WHAT got done (task completion), misses how longit really took (accurate hours). Shows 100 tasks completed but can’t tell you if you’re over/under labor budget. Great for progress tracking (“are we on schedule?”), terrible for efficiency measurement (“are we over labor hours?”).
Score Breakdown:
Time Accuracy & Fraud Prevention: 7/20
- Can track hours worked and costs at task completion level
- Timestamped activities and task updates
- Photo documentation of work
- Gap: 13 points deducted because not a time tracking solution (tracks task completion, not clock-in/out), no biometric verification whatsoever, no systematic daily time capture, supervisor reports manpower used on tasks (honor system), no fraud prevention features, essentially task logging not workforce time tracking, no audit trails for time data, can’t prevent buddy punching, no verification of worker identity, no fob option, time data completely unreliable for payroll/productivity
Field Readiness & Deployment: 17/20
- Mobile-first design – works great on phones/tablets
- Excellent offline functionality (syncs when online)
- Fast plan viewer works offline
- Under 5-minute setup for new projects
- Designed FOR field workers
- Gap: 3 points deducted because not weatherproof hardware (phone/tablet dependent), requires charged devices (device dies = lose access to plans and task management), file size limits (25MB per file can be restrictive)
Construction-Specific Features: 13/20
- Outstanding for: Plan viewing/markup, task management, punch lists, RFIs, daily reporting, photo documentation
- Calendar scheduling, Gantt charts, custom task statuses
- Integrates plans with tasks and locations
- Version control for drawings
- Gap: 7 points deducted because NOT built for detailed time tracking, no payroll integration, no cost codes for labor allocation, weak scheduling compared to dedicated tools (no crew scheduling, no dispatch), no workforce planning, limited job costing features (no labor cost tracking), “no time tracking” per user reviews, can’t measure labor productivity
Integration Ecosystem: 11/15
- Accounting/payroll integrations available
- Cloud storage connections (Dropbox, Box, Google Drive)
- Can export data for other systems
- Part of Hilti ecosystem
- Gap: 4 points deducted because limited compared to Procore (no 500+ marketplace), no major ERP integrations mentioned (no Vista, CMiC, Foundation), users report difficulty with file uploads/management, no PowerBI/Tableau native integration
Scalability: 14/15
- Used on 2M+ projects globally
- Works for GCs and specialty contractors
- Unlimited projects and storage on premium plans
- Multi-project visibility
- Gap: 1 point deducted because per-user pricing for ALL users (including external subs) limits collaboration scalability – costs add up quickly on large projects with many sub trades
User Experience & Support: 5/5
- Capterra: 4.6/5, G2: 4.5/5 (strong genuine ratings)
- “Easy to deploy, learn & use every day”
- “10 times easier than other tools”
- Mobile app: iOS 4.8/5, strong user love
- Great support mentioned frequently
- MINOR COMPLAINTS: Some choppy drawing tools, file size limits (25MB), search functionality could be better
Value & Transparency: 5/5
- Transparent pricing: Free to $89/user/month
- 4 clear tiers (Basic free, Pro $39, Business $59, Business Plus $89/user/month)
- Annual plans offer discount
- Strong ROI reported: “5 hours saved per user per week,” “10x to 30x ROIs”
- Free tier available for small teams
- NOTE: Per-user pricing for external subs can add up, but pricing is clear
#6. CrewTracks - Overall Score: 62/100 - GOOD
The Bottom Line
Mobile-first time tracking with scheduling. Works well for smaller, mobile crews but lacks the sophisticated fraud prevention needed to ensure accurate productivity metrics at scale.
The Productivity Impact: Basic productivity visibility. Basic job costing shows labor cost per project. Severe Gap: No identity verification = can’t trust the time = can’t trust productivity metrics. One worker clocking in 3 others destroys your calculations.
Score Breakdown:
Time Accuracy & Fraud Prevention: 9/20
- GPS geofencing
- Photo capture on clock-in
- Location verification
- Gap: 11 points deducted because no biometric facial verification, relies primarily on GPS + photo (both easily circumvented), editable timesheets create major vulnerability, honor system with location checks only, no fob option for phoneless workers, photo can be shown to camera by anyone (buddy punching still possible), no tamper-proof audit trails
Field Readiness & Deployment: 13/20
- Mobile app-based solution
- Works on personal smartphones
- Quick deployment (under 1 week)
- Easy to use interface
- Gap: 7 points deducted because requires cell service or WiFi (no built-in LTE), not weatherproof (phone-dependent), no dedicated hardware option, device dies/breaks = no time tracking, requires personal smartphone (privacy concerns, device management issues), no offline capability mentioned
Construction-Specific Features: 14/20
- Time tracking with GPS
- Job costing and cost codes
- Scheduling and dispatch
- Equipment tracking
- Daily logs and notes
- Break management
- Gap: 6 points deducted because limited multi-site visibility (no real-time dashboard across all projects), basic compliance features (no prevailing wage automation, no union support), no T&M ticketing, no integration with safety/quality modules, limited reporting capabilities
Integration Ecosystem: 9/15
- QuickBooks integration (primary)
- Basic accounting exports (CSV, Excel)
- Gap: 6 points deducted because limited native integrations (essentially only QuickBooks), no major ERP connections (no Vista, CMiC, Foundation, Procore), basic API capabilities (not robust), no PowerBI/Tableau integration, no payroll processor integrations beyond QuickBooks, limited ecosystem
Scalability: 9/15
- Best fit: 10-100 employees
- Works for smaller operations
- Multi-site capability but limited
- Gap: 6 points deducted because not proven at enterprise scale (500+), limited documentation for large implementations, GPS breadcrumbing becomes expensive at scale (data costs), no documentation for 1,000+ workers, limited multi-site real-time visibility problematic for growing operations, single-project focus in UI/UX
User Experience & Support: 4/5
- Mobile apps well-rated (4+/5)
- Simple, intuitive interface
- Good customer support
- Quick onboarding
- Gap: 1 point deducted because minor complaints about feature depth, some users report wanting more advanced features
Value & Transparency: 4/5
- Transparent pricing published on website
- Free trial available
- Affordable for smaller contractors
- Good value for target market
- Flexible subscription terms
- Gap: 1 point deducted because no documented ROI calculations provided, pricing transparency exists but value proposition not as strong as leaders (no hard savings numbers)
#7. WorkMax (AboutTime) - Overall Score: 59/100 - GOOD
The Bottom Line
Older technology acquired by Foundation. Strong ERP integration legacy, but aging product architecture shows compared to modern solutions. Gets hours into payroll – minimal productivity insights beyond that.
The Productivity Impact: Basic time-to-payroll. Gets hours into payroll system for minimal productivity insights beyond basic job costing. Legacy reporting limits productivity analysis capabilities. You can see total hours per job, but can’t drill into efficiency metrics or trends.
Score Breakdown:
Time Accuracy & Fraud Prevention: 9/20
- Multiple clock-in options (web, phone, mobile)
- Basic location tracking available
Gap: 11 points deducted because no biometric verification whatsoever, legacy technology from pre-mobile era (10+ years old), relies on PIN codes and passwords (easily shared for buddy punching), editable timesheets with no verification, no photo capture, no fob option, no fraud prevention features, honor system with manual oversight
Field Readiness & Deployment: 10/20
- Multiple access methods (flexibility)
- Works on various devices
Gap: 10 points deducted because requires internet connectivity (no offline capability), older interface design (not mobile-first), NOT purpose-built for field conditions, significant training required (not intuitive), no weatherproof hardware option, device-dependent (phones/tablets), setup requires configuration and training, legacy UI difficult for field workers, no quick deployment option
Construction-Specific Features: 13/20
- Time tracking and timesheets
- Job costing integration
- Cost code tracking
- Union and prevailing wage support
- Multiple pay types
Gap: 7 points deducted because limited modern features (no mobile-first design, no real-time dashboards), no native daily reporting, no safety module, no quality control, no equipment tracking, no T&M ticketing, legacy reporting (limited analytics), no multi-site visibility dashboard
Integration Ecosystem: 12/15
- Historic strength: Integrates with most ERPs
- Strong Foundation (parent company) integration
- Vista, Viewpoint Spectrum connections
- Accounting system integrations
- Legacy API available
Gap: 3 points deducted because legacy API (not modern REST API), limited modern business intelligence tool integrations (no PowerBI/Tableau native), integration setup can be complex, some integrations require middleware, Foundation ecosystem lock-in
Scalability: 11/15
- Proven with mid-sized contractors
- Multi-site capable
- Used by established companies
Gap: 4 points deducted because limited growth documentation (aging user base, not attracting new large customers), aging user base suggests limited new enterprise adoption, no documentation for 1,000+ worker deployments, performance at scale unclear (legacy technology), modern competitors preferred by growth-stage companies
User Experience & Support: 2/5
- Foundation support after acquisition (ties to larger ecosystem)
Gap: 3 points deducted because dated user interface (10+ year old design patterns), Foundation support not dedicated to AboutTime, learning curve reported by users, mixed user reviews (3-4/5 average, not 4.5+), older mobile experience (not mobile-first design), support quality varies
Value & Transparency: 2/5
- Part of Foundation ecosystem (benefit if already using Foundation)
Gap: 3 points deducted because pricing through Foundation only (not transparent), must request quote (zero pricing disclosure), contract required (no month-to-month flexibility), limited transparency around pricing structure, no documented ROI calculations, value unclear compared to modern alternatives
#8. Archdesk - Overall Score: 58/100 - GOOD
The Bottom Line
UK-based construction ERP offering end-to-end business management. Time tracking is ONE module of many. Users report functionality “falls flat” and creates “double entry” work instead of reducing it.
The Productivity Impact: Job costing productivity across full ERP. Time feeds real-time budget vs actual dashboards = cost productivity insights across multiple projects. Gap: Time accuracy issues (no biometric, supervisor-led) undermine productivity calculations. If hours are wrong, all downstream productivity metrics are wrong.
Score Breakdown:
Time Accuracy & Fraud Prevention: 8/20
- Multi-level approval workflows for timesheet validation
- Automated calculations for different pay rates and conditions
Gap: 12 points deducted because NO biometric verification of any kind, still supervisor-led time entry in many cases (not worker-led), editable timesheets with no verification, relies on GPS alone which proves location not identity, no photo capture mentioned in documentation, no fob option, no fraud prevention features documented, honor system with approval workflows
Field Readiness & Deployment: 10/20
- Cloud-based mobile access to timesheets and attendance
- Works on tablets and smartphones
- Real-time data synchronization
Gap: 10 points deducted because NOT purpose-built for field (office-first design per user reviews), requires training (“not always intuitive,” “off-putting documentation” per reviews), no weatherproof hardware option, dependent on devices/internet connectivity, setup complexity for comprehensive platform (ERP deployment typically multi-month), users report “not easy to roll out to wide teams,” no offline capability mentioned
Construction-Specific Features: 15/20
- Comprehensive: Estimating, procurement, job costing, scheduling, document management, asset tracking
- Budget vs. actual tracking, variance analysis
- Cost code allocation to projects and work packages
- Program/schedule integration
- Multi-project management and real-time dashboards
Gap: 5 points deducted because time tracking is ONE module of many (not specialized), users report “falls flat on a lot of features,” estimating module needs improvement per reviews, no native daily logs mentioned, users report needing external spreadsheets to track work (system not comprehensive despite claims)
Integration Ecosystem: 9/15
- Integrates with QuickBooks, Xero, Sage (though users report Sage integration “never fully happened”)
- Can work with other accounting and ERP systems
- PowerBI for reporting
Gap: 6 points deducted because limited native integrations compared to leaders, users report “double entry” issues (integration promises not delivered), integration promises not always delivered per reviews (specifically Sage), no major construction PM software integrations mentioned (no Procore, no Raken, etc.), users report creating workarounds due to poor integrations
Scalability: 13/15
- Built for mid-to-large contractors and production companies
- Real-time visibility across multiple projects
- Customizable dashboards for different organizational levels
- Centralized data management
Gap: 2 points deducted because users report system “can be slow” at scale, needs improvement on speed/performance per reviews
User Experience & Support: 2/5
- Capterra: 4.8/5, G2: 4.6/5 (but many incentivized reviews noted)
- Reported as “fairly user-friendly” by some users
Gap: 3 points deducted because “not always intuitive” per reviews, “not easy to roll out to wide teams,” “clunky,” “mediocre,” support is “average” not excellent, “long-winded to update,” users report needing external spreadsheets (system not solving problems), compliance issues (users can delete documents without notification per reviews)
Value & Transparency: 1/5
- Starting price disclosed ($790/month provides some transparency)
Gap: 4 points deducted because expensive for what users report getting ($790/month for “average” functionality per reviews), users feel “sold” by sales team but actual functionality is “mediocre,” multiple users in contract wishing they could explore alternatives (value not delivered), CRITICAL user feedback: “Reflow wasn’t fit for the job,” promises not delivered (specifically Sage integration), creates “double entry” work instead of reducing it, must request full quote for actual pricing (starting price only), no documented ROI, no free trial mentioned
Methodology:
All scores based on SmartBarrel’s published 7-Factor Scoring System evaluating Time Accuracy & Fraud Prevention (20%), Field Readiness & Deployment (20%), Construction-Specific Features (20%), Integration Ecosystem (15%), Scalability (15%), User Experience & Support (5%), and Value & Transparency (5%). Research compiled from vendor websites, verified user reviews (G2, Capterra, Software Advice, App stores), independent analysis, and publicly available documentation.
Last Updated: February 2026
Final Takeaway
Construction productivity tracking software delivers value when built on accurate time tracking data. Many construction companies start backwards – selecting comprehensive project management platforms and expecting time tracking accuracy to come included. Then productivity metrics don’t improve, job costing remains estimated, and T&M billing creates disputes.
The effective approach: Build the foundation first. Accurate time capture with face-match technology, real-time data flow, and multi-site visibility. Then layer project management, financial analysis, and business intelligence on top of reliable data.
SmartBarrel provides that foundation – delivering the most accurate time from the field for construction businesses running 3 sites or 30. Everything else flows from accurate data enabling project teams to make informed decisions, track project progress effectively, and optimize productivity levels across all operations.